

BIOSPECTRUM ASIA | EARNINGS ALERTS
|
+35.2% |
10.7 pt |
-15% |
EUR 0.15 |
|
Celltrion revenue growth, the strongest in Asia-Pacific |
Gap between Takeda's reported and constant-currency growth |
Roche sales in China, on pricing reform |
Siemens Healthineers EPS guidance lift, from tariff refunds |
There is a version of the June 2026 quarter in which almost every large biopharmaceutical and medical technology company on earth had a good three months.There is another version, built from the same filings, in which several of them went backwards. Both versions are accurate. The difference between them is almost entirely a matter of what currency you count in, which fiscal calendar you use, and whether you strip out the cost of the deals that were signed during the period.
For readers in Asia-Pacific this is not an accounting footnote. It is the whole story. Between 21 July and 6 August, more than twenty of the sector's largest companies reported results covering the same three months, and the pattern that emerges when you line them up is unusually clear: the region delivered a disproportionate share of the operating growth, absorbed a disproportionate share of the pricing pain, and appeared in the reported figures of Western majors mostly as a drag. Understanding why requires taking the numbers apart.
The first thing to fix is the calendar. Sun Pharma's Q1 FY27, Pfizer's Q2 2026, Takeda's Q1 FY2026 and Siemens Healthineers' Q3 FY2026 are all the same three months. Medtronic's Q1 FY27 is too. Any comparison built on the quarter label rather than the calendar period will be wrong before it starts, and a surprising amount of the commentary published in the last fortnight has been built exactly that way.
Start with Roche, because Roche states the problem more plainly than anyone. Group sales for the first half came in at CHF 30.4 billion. At constant exchange rates that is growth of 6 per cent. Reported in Swiss francs it is a decline of 2 per cent. The appreciation of the franc against the dollar and most other currencies accounted for the entire eight-point swing. Nothing about the underlying business changed between those two numbers.
"Our strong momentum continued in the first half of the year"
Thomas Schinecker, Chief Executive Officer, Roche
Takeda produced the mirror image. Revenue for its first fiscal quarter rose 10.2 per cent at actual exchange rates to 1,219.9 billion yen, and fell 0.5 per cent at constant rates. The yen did the work in one direction; the franc did it in the other. Novartis landed between the two, with net sales of $14.408 billion representing 1 per cent growth at constant currencies and 3 per cent in dollars.
Table 1: The reported-versus-operational gap, calendar Q2 2026
|
Company |
Reported growth |
Constant-currency growth |
Gap |
|
Roche (H1) |
-2% (CHF) |
+6% |
8 points |
|
Takeda |
+10.2% (AER) |
-0.5% |
10.7 points |
|
Novartis |
+3% (USD) |
+1% |
2 points |
|
Sanofi |
+16.0% |
+17.8% |
1.8 points |
|
Boston Scientific |
+7.5% |
+7.0% organic |
0.5 points |
|
Stryker |
+9.4% |
+9.0% |
0.4 points |
Compiled from company results announcements, 21 July to 6 August 2026. AER: actual exchange rates.
Figure 1. The same quarter, counted two ways
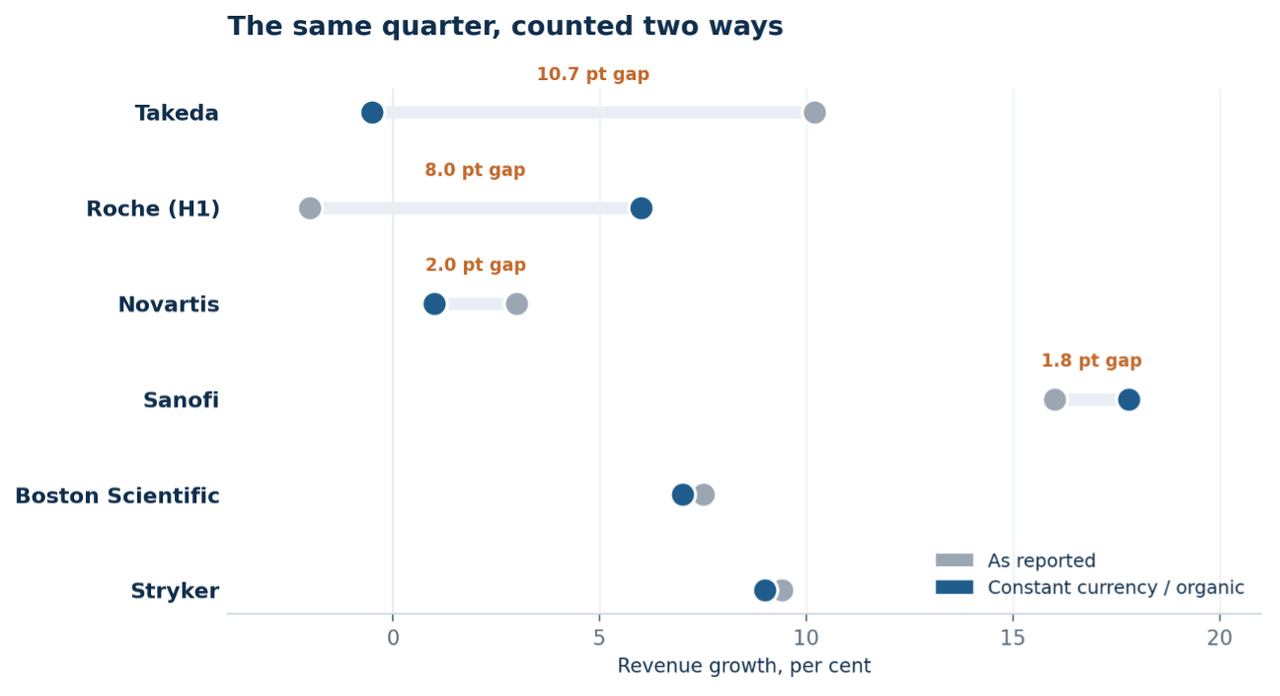
Each company's own reported and constant-currency figures. Roche and Takeda move in opposite directions on identical trading.
The gap matters most for anyone underwriting Asian manufacturing capacity, because it runs the other way for producers who earn in dollars and spend in local currency. Biocon is the cleanest illustration. Roughly three quarters of its biosimilar revenue sits in advanced markets, and the rupee averaged around 92.5 against the dollar in the June quarter compared with 85.5 a year earlier. A meaningful share of Biocon's reported top line growth is a translation effect, not a volume effect, and the company's own commentary is careful about the distinction. Samsung Biologics said much the same thing when it credited favourable currency conditions alongside full capacity utilisation across its first four plants.
If the currency story is the quiet one, the metabolic story is the loud one. Eli Lilly reported revenue growth of 48 per cent for the quarter and raised full-year guidance to a range of $85 billion to $87 billion, up from $82 billion to $85 billion. It was the first quarter to include sales of the company's oral obesity medicine, approved in the United States in April.
"Lilly's momentum continues, as we delivered 48% revenue growth"
David A. Ricks, Chair and Chief Executive Officer, Eli Lilly and Company
Novo Nordisk, reporting the same three months, cut its outlook. Adjusted sales of DKK 78,488 million represented 7 per cent growth at constant rates and adjusted operating profit rose 11 per cent, but the company now expects full-year adjusted sales growth of 0 per cent to minus 6 per cent at constant rates, with operating profit in the same band. The quarter also carried DKK 6.3 billion of non-cash impairment charges against intangible pipeline assets, including a single asset written down by DKK 4.0 billion.
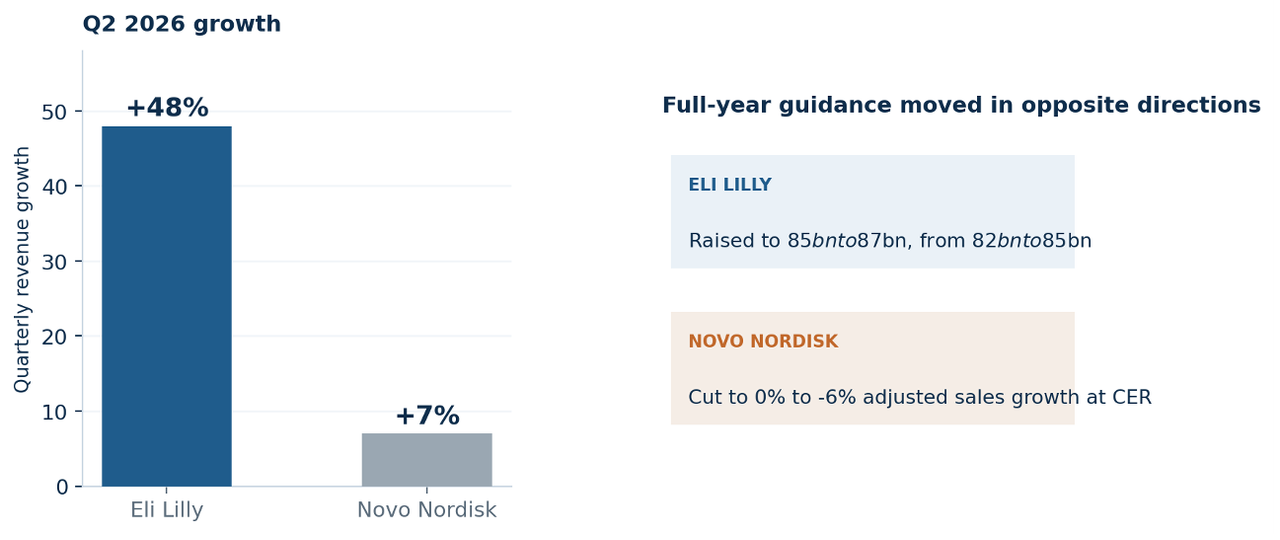
Figure 2. One category, two directions
Lilly and Novo Nordisk reported the same three months. Guidance moved the opposite way.
For Asia-Pacific the implications are commercial rather than clinical. The GLP-1 category has been the single largest driver of new fill-finish demand, device assembly capacity and cold chain volume across the region for three years. A category that is still growing but where one of the two anchor customers has just guided to a flat-to-declining year is a different planning input from a category where both are compounding. Contract manufacturers in Korea, Japan, Singapore and India who built capacity assumptions on a two-horse race should be rereading their commitments.
Three of the largest companies in the sector reported a loss or a sharply reduced profit for the quarter, and in each case the cause was a transaction rather than a business.
Merck posted worldwide sales of $16.6 billion, up 5 per cent, and a GAAP loss per share of $0.54 against earnings per share of $1.76 a year earlier. Both the GAAP and non-GAAP figures carry a charge of $2.31 per share for the acquisition of Terns Pharmaceuticals. Strip that out and the quarter was a straightforward beat, with Keytruda at $8.4 billion including $463 million from the newly launched subcutaneous formulation, and Winrevair up 75 per cent to $588 million. The company raised and narrowed its full-year revenue guidance to $66.3 billion to $67.3 billion while lowering earnings guidance to absorb the deal.
Lilly's headline earnings per share of $7.94 similarly carried $3.03 per share of acquired in-process research and development charges, against $0.14 in the same quarter last year. Pfizer's reported loss for the quarter reflected intangible asset impairments, and its guidance absorbs roughly $0.10 per share related to its Innovent Biologics transaction. Danaher's increased full-year earnings guidance is partly attributable to completing the Masimo acquisition earlier than anticipated.
What makes this quarter distinctive is that the deal flow is no longer one-directional. Samsung Biologics is entering the peptide contract manufacturing market through an acquisition of Switzerland's PolyPeptide Group valued at around KRW 2.7 trillion. Celltrion is diversifying through a United States transaction. Sun Pharma's shareholders approved its Organon acquisition on 24 July, with closing expected in the fourth quarter of the current fiscal year. Boston Scientific put $1.5 billion into MiRus during the quarter. Asian companies are now appearing on the buy side of the ledger at scale, and the charges that suppress their reported earnings are the same kind of charges suppressing Merck's.
Table 2: One-off charges distorting reported earnings, calendar Q2 2026
|
Company |
Reported bottom line |
Charge |
Underlying read |
|
Merck & Co |
GAAP loss per share $0.54 |
$2.31 per share, Terns acquisition |
Sales up 5% to $16.6bn; revenue guidance raised |
|
Eli Lilly |
GAAP EPS $7.94, up 26% |
$3.03 per share, acquired IPR&D |
Revenue up 48%; guidance raised |
|
Pfizer |
Reported loss for the quarter |
Intangible asset impairments; Innovent impact |
Launched and acquired products up 18% operationally |
|
Novo Nordisk |
Adj. operating profit up 11% cc |
DKK 6.3bn pipeline impairments |
Full-year outlook cut to 0% to -6% |
|
Danaher |
Net earnings $870m, up 60% |
Masimo close pulled forward |
Adjusted EPS $1.94, up 8%; guidance lifted |
Charges as disclosed in each company's own results announcement.
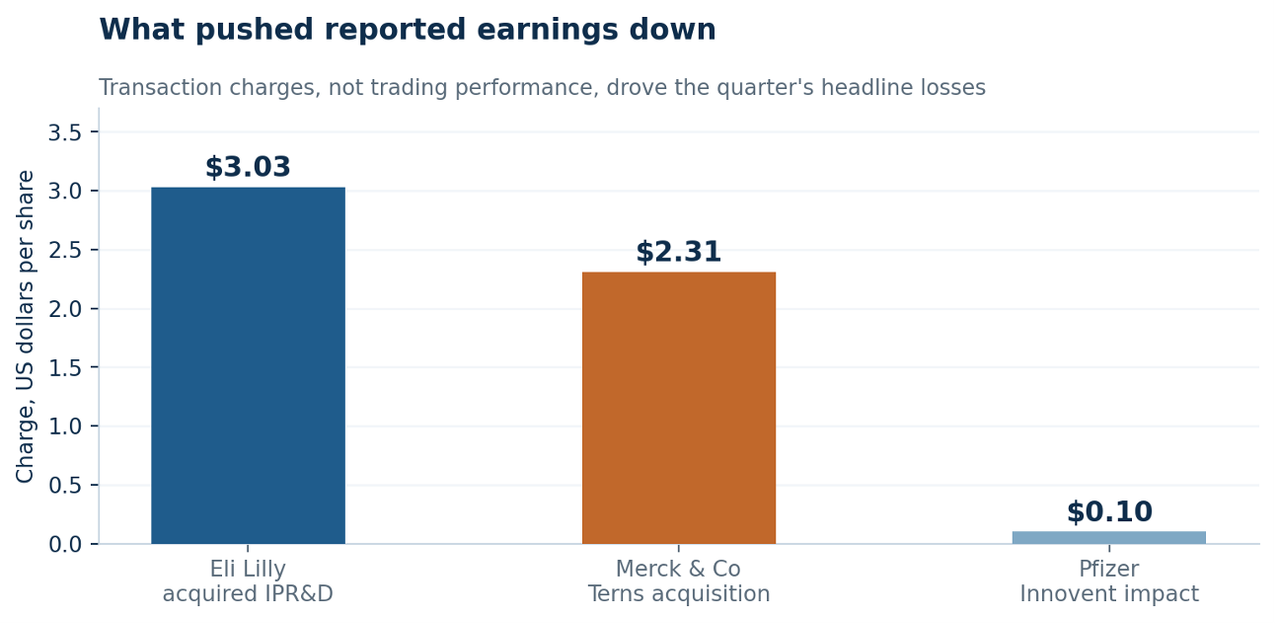
Figure 3. What pushed reported earnings down
Per-share transaction charges disclosed in Q2 2026 results. Novo Nordisk's DKK 6.3 billion impairment is excluded as it is not stated per share.
Set the accounting aside and look at operating performance, and the geographic pattern is stark. The strongest growth rates in the entire reporting cohort belong to Asia-Pacific manufacturers.
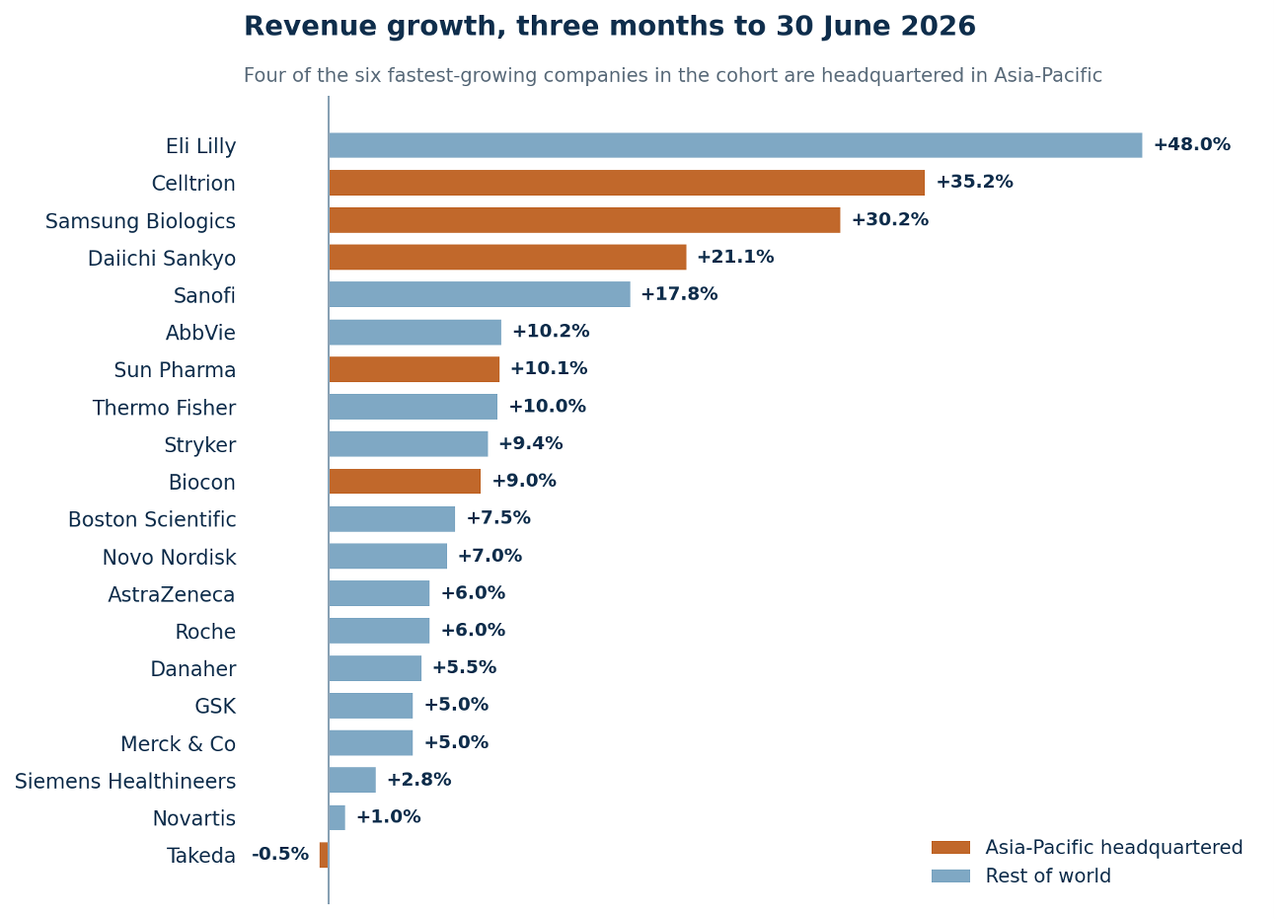
Figure 4. Revenue growth across the reporting cohort, three months to 30 June 2026
Each company's headline revenue growth as stated in its own results announcement. Bases differ; where both are disclosed, the constant-currency figure is used. Biocon shown on total income.
Samsung Biologics recorded second-quarter revenue of KRW 1,321 billion and operating profit of KRW 586.4 billion, up 30.2 per cent and 22.9 per cent respectively. Operating margin held at 44.4 per cent even after absorbing start-up costs and depreciation from Plant 5 and the Rockville, Maryland facility. First-half operating profit passed KRW 1 trillion for the first time in the company's history.
"strengthen our order competitiveness and sustain our decisive competitive edge"
Samsung Biologics, on its three pillars of capacity, portfolio and global presence
Celltrion posted second-quarter revenue of roughly KRW 1.3 trillion and operating profit of KRW 430 billion, increases of 35.2 per cent and 77.3 per cent, its best second quarter on record and ahead of its own KRW 400 billion internal target. Operating margin improved from 25 per cent to 33 per cent. Analysts now expect both Korean companies to clear KRW 5 trillion in annual revenue in the same year for the first time, with the gap between them narrowing to around KRW 100 billion. Two distinct models, one built on contract manufacturing scale and one on a portfolio shift into higher-margin next-generation biosimilars, have arrived at structurally similar profitability.
Daiichi Sankyo delivered global revenue of 574.7 billion yen, up 21.1 per cent, and revised its full-year guidance upward from the forecast issued in May. The growth is concentrated in its antibody drug conjugate franchise: Enhertu revenue including milestone payments reached 239.8 billion yen, up 48.9 per cent, and Datroway reached 23.9 billion yen, up 176.4 per cent. Operating profit fell 12.0 per cent to 85.1 billion yen, but the cause was restructuring expense in the European specialty business, not weakness in the growth engine. The company's Asia, South and Central America business contributed 68.7 billion yen, driven by Enhertu.
Takeda's quarter was quieter and, in its own framing, deliberately so. Revenue growth of 10.2 per cent at actual rates masked a flat constant-currency result as the loss of exclusivity on Vyvanse was largely offset by the core in-line portfolio. The company left its full-year forecast and management guidance unchanged and has set a capital markets day for 11 December in Tokyo.
"Our solid performance this quarter marks a good start to the fiscal year"
Julie Kim, President and Chief Executive Officer, Takeda
Here is the uncomfortable half of the regional picture. The same three months in which Asian manufacturers posted record output were three months in which Asia, and specifically China, subtracted from Western revenue lines.
Roche disclosed that sales in China fell 15 per cent on the back of healthcare pricing reforms, and that this weighed on growth across the Asia-Pacific region as a whole. Siemens Healthineers cut its full-year revenue growth guidance from a range of 4.5 to 5.0 per cent down to 3.5 to 4.0 per cent, citing continued weakness in Diagnostics and pointing specifically at China market rebasing alongside legacy platforms in North America. The Diagnostics segment posted a 3 per cent margin and management expects another mid-single-digit revenue decline in the fourth quarter.
The distinction worth holding onto is that this is a pricing and reimbursement effect, not a demand effect. Volume-based procurement and pricing reform compress the value of the same units. For a Western multinational reporting in euros or francs, that shows up as a revenue decline. For a regional supplier competing on cost, the same reform is a share opportunity. The two readings are not in conflict; they are the same policy seen from opposite sides of a tender.
Roche's group performance was nonetheless strong, with core operating profit growing 10 per cent against sales growth of 6 per cent, five United States priority reviews granted and an 80 per cent Phase III success rate across the half. A negative flu season impact of more than $200 million and biosimilar pressure in ophthalmology were the offsetting drags.
India's listed pharmaceutical majors reported their first quarter of fiscal 2027 across a two-week window, and the shape of the quarter was consistent: strong domestic growth, weak United States generics, and margin compression from costs rather than pricing.
Sun Pharma reported sales of Rs 151,836 million, growth of 10.1 per cent, with net profit rising to Rs 28,948 million. India formulations, the largest reporting segment, grew 16 per cent to Rs 54,749 million and now accounts for 36.1 per cent of consolidated sales. Global innovative medicines reached $351 million, up 12.8 per cent and 21.9 per cent of sales. Against that, United States formulation sales fell 9.7 per cent to $427 million as generics declined faster than innovative medicines could offset. EBITDA rose 2.7 per cent to Rs 44,177 million, with margin at 28.9 per cent, held back by one-time acquisition and labour-related costs.
"strong momentum in India as well as Innovative Medicines"
Kirti Ganorkar, Managing Director, Sun Pharmaceutical Industries
Cipla delivered its highest ever first-quarter revenue at Rs 7,119 crore, with the One India business posting record quarterly revenue on 12 per cent year-on-year growth and the branded prescription business growing 15.4 per cent across the chronic portfolio. The margin told a different story. EBITDA margin came in at 16.7 per cent, well below the company's full-year guidance range of 18.5 to 20 per cent, with management attributing the squeeze to cost inflation linked to the current conflict environment and higher inventory carrying costs.
"we have delivered the highest ever Q1 revenue"
Cipla management, Q1 FY27 earnings call, 23 July 2026
Biocon reported total income of Rs 4,391 crore, up 9 per cent, with consolidated net profit of Rs 141 crore against Rs 31.4 crore a year earlier. The profit recovery is the headline, and it is real, but the mechanics are worth reading carefully: gross profit grew only 2.0 per cent while revenue grew 10 per cent, which is margin compression at the input line. The offsetting improvements came from finance costs, which declined following the retirement of structured debt, and from the consolidation of Biocon Biologics as a wholly owned subsidiary with effect from 29 June, which now directs the full profit of that business to Biocon shareholders.
Table 3: India majors, Q1 FY2026-27 (April to June 2026)
|
Company |
Revenue |
Growth |
Profit signal |
|
Sun Pharma |
Rs 151,836 mn |
+10.1% |
Net profit Rs 28,948 mn, up 27%; EBITDA margin 28.9% |
|
Cipla |
Rs 7,119 crore |
Record Q1 |
EBITDA margin 16.7% against 18.5-20% guidance |
|
Biocon |
Rs 4,391 crore total income |
+9% |
PAT Rs 141 crore against Rs 31.4 crore |
Figures as reported by each company. Reporting conventions differ; Sun Pharma reports in million, Cipla and Biocon in crore.
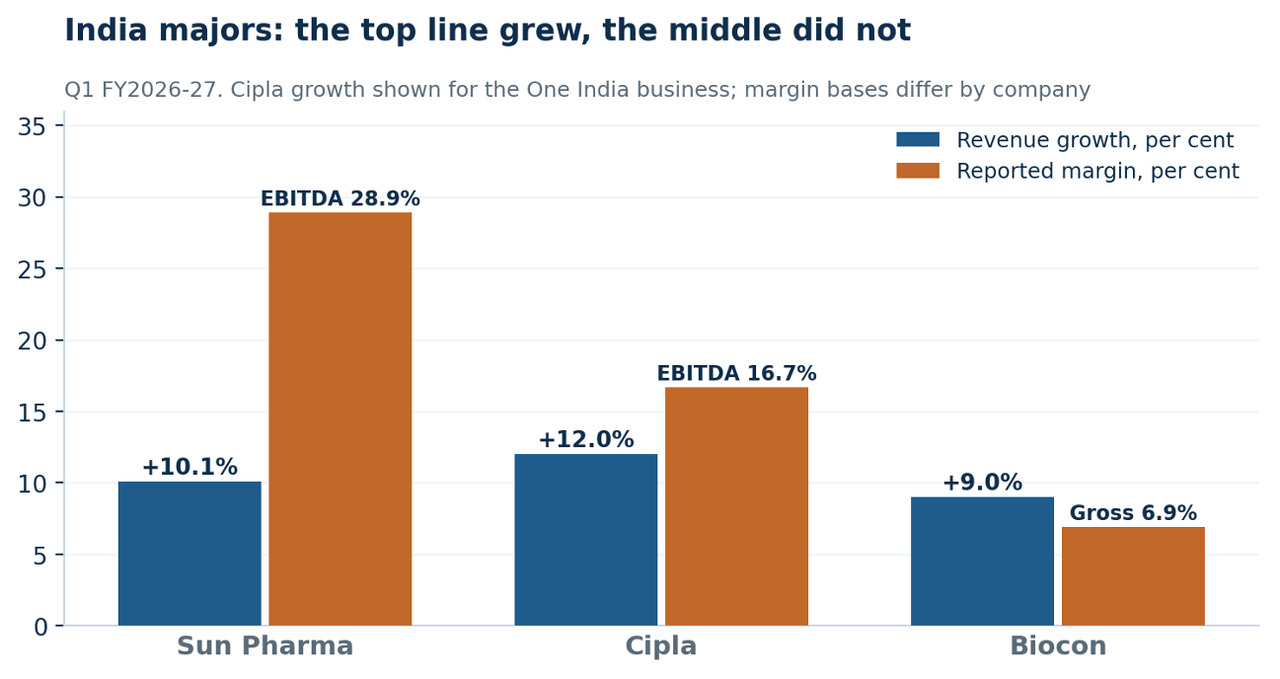
Figure 5. India majors: the top line grew, the middle did not
Q1 FY2026-27. Margin bases are not directly comparable; Sun Pharma and Cipla shown on EBITDA, Biocon on gross margin.
The common thread across all three is that the domestic Indian market is carrying the quarter while the export book absorbs pressure. That is a reversal of the pattern that defined Indian pharmaceutical earnings for most of the last decade, and it has direct consequences for the September tariff question.
Life sciences tools and bioprocessing suppliers are the closest thing the sector has to a leading indicator, because their order books reflect what manufacturers are building rather than what they are currently selling. Only two of the major suppliers reported inside this window: Thermo Fisher Scientific and Danaher. One of them accelerated.
Thermo Fisher Scientific posted revenue of $11.99 billion for the quarter ended 27 June, growth of 10 per cent with organic growth of 5 per cent. Adjusted earnings per share reached $6.03, up 13 per cent, and adjusted operating margin improved to 22.8 per cent from 21.9 per cent.
"We delivered outstanding performance in the second quarter"
Marc N. Casper, Chairman and Chief Executive Officer, Thermo Fisher Scientific
Management's characterisation of end markets as continuing to strengthen is the single most useful forward-looking sentence in the entire reporting cohort for anyone in Asian bioprocessing.
Danaher's quarter was steadier rather than faster, and the distinction matters. Revenues rose 5.5 per cent to $6.3 billion, but non-GAAP core revenue grew 3.0 per cent, or 4.5 per cent once respiratory testing is excluded, and full-year core revenue guidance sits at 3.0 to 4.0 per cent. The lift in adjusted earnings per share guidance to $8.45 to $8.60 is partly attributable to completing the Masimo acquisition earlier than anticipated, which is a timing effect rather than a demand signal. Anyone reading the tools sector as uniformly recovering should note that only one of these two companies is growing faster than it was.
Read together, the two do agree on the shape of the market: instrument and consumable demand is recovering while the diagnostics-adjacent businesses remain soft. That is exactly the split Siemens Healthineers reported from the other end of the same market. For the region's contract development and manufacturing organisations, the tools order book remains the more relevant signal, but it is pointing upward less uniformly than the headline revenue numbers suggest.
Medical technology produced the least ambiguous results of the reporting season, largely because the sector is less exposed to the deal charges and impairments that muddied pharmaceutical earnings.
Boston Scientific generated net sales of $5.442 billion, growing 7.5 per cent reported and 7.0 per cent on both an operational and organic basis. GAAP net income reached $907 million or $0.61 per share, with adjusted earnings per share of $0.86 against $0.75 a year earlier. The company raised full-year guidance to 5.5 to 6.5 per cent reported growth and 5 to 6 per cent organic, while guiding third-quarter growth to a more modest 3 to 5 per cent.
"a solid quarter while continuing to navigate a dynamic environment"
Mike Mahoney, Chairman and Chief Executive Officer, Boston Scientific
Stryker's quarter is the more instructive one for operational readers, because it is a recovery quarter. Net sales rose 9.4 per cent to $6.6 billion with organic growth of 9.0 per cent driven by unit volume, adjusted operating margin improved 170 basis points to 27.4 per cent, and adjusted earnings per share rose 17.9 per cent to $3.69. MedSurg and Neurotechnology grew 9.7 per cent to $3.6 billion. All of this came while the company was still working through the effects of a cyber incident.
"we enter the second half of 2026 with regained momentum"
Kevin A. Lobo, Chair and Chief Executive Officer, Stryker
A medical device manufacturer recovering from a cyber incident to post 9 per cent organic growth in the same quarter is a data point that belongs in every hospital procurement and supply chain risk conversation in Asia-Pacific this year, particularly for institutions that single-source implantable inventory.
Siemens Healthineers reported revenue of EUR 5.8 billion, up 2.8 per cent, with an equipment book-to-bill ratio of 1.27, or approximately 1.17 excluding new value partnerships. Imaging and Precision Therapy together grew 5 per cent, with Precision Therapy up 9 per cent. The order book is strong; the revenue conversion is not.
"We showed great order momentum."
Bernd Montag, Chief Executive Officer, Siemens Healthineers
GE HealthCare pre-announced preliminary second-quarter figures on 23 July alongside a chief financial officer transition, reporting revenue growth of 5.7 per cent and organic growth of 3.5 per cent, with adjusted earnings per share ahead of prior expectation and full-year guidance reaffirmed.
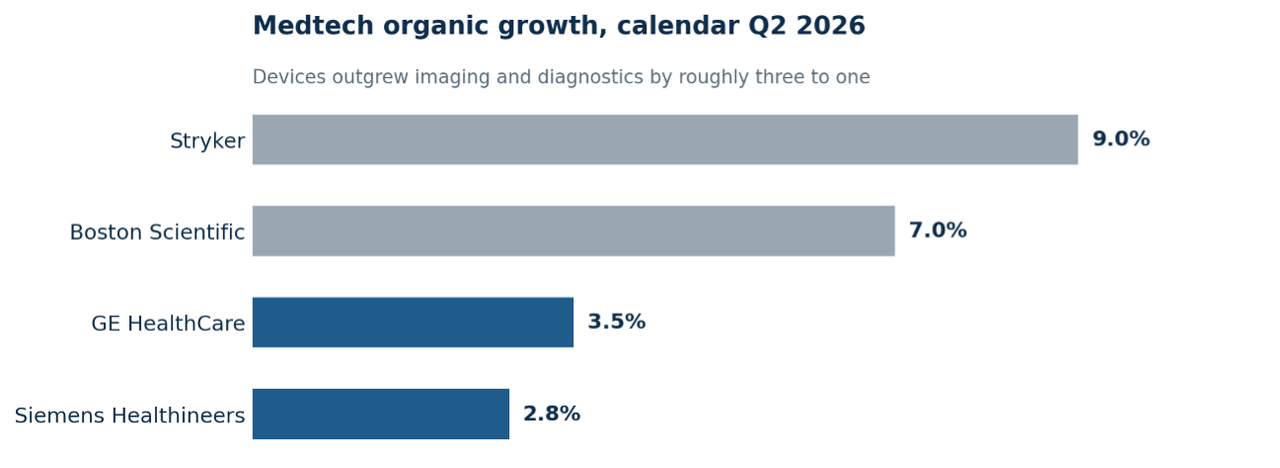
Figure 6. Medtech organic growth, calendar Q2 2026
Devices outgrew imaging and diagnostics by roughly three to one. GE HealthCare figure is preliminary as pre-announced on 23 July.
For most of the last year, tariffs have appeared in biopharmaceutical and medical technology filings as forward-looking risk language. In this quarter, for the first time, they appear as a number.
Siemens Healthineers raised its adjusted earnings per share guidance by EUR 0.15 to a range of EUR 2.35 to EUR 2.45, and attributed the increase specifically to refunds of tariffs imposed under the United States International Emergency Economic Powers Act received during the quarter. The company was explicit that underlying earnings expectations were unchanged. Tariff refunds also improved reported profitability and cash flow materially, with more than EUR 1 billion generated in the quarter.
Danaher's risk disclosure now leads with the impact of tariffs and related actions implemented by the United States and other countries. Pfizer announced an additional $2.5 billion of anticipated productivity savings tied to its ongoing initiatives, to be realised between 2027 and 2029, in the same release that raised revenue guidance. Cipla named cost inflation as the driver of its margin miss.
None of this yet reflects the second Section 232 deadline on 29 September, which is the event that will determine how much of Asia's pharmaceutical trade is genuinely exposed and how much is sheltered by the generics and biosimilars carve-out. What this quarter establishes is that the machinery is already moving through the profit and loss statements of companies on both sides of the trade, in both directions, and that a refund can shift full-year guidance as decisively as a levy can.
For Indian exporters in particular, the June quarter numbers set an uncomfortable baseline. Sun Pharma's United States formulation sales were already down 9.7 per cent before any new tariff line applies, with the decline attributed to specific product competition and compliance issues delaying approvals. A cost shock landing on a book that is already contracting is a materially different proposition from one landing on a book that is growing.
Five things are worth tracking as the next reporting cycle approaches.
The currency base resets. Much of the reported growth and the reported decline in this quarter was translation. If exchange rates hold near current levels, the year-on-year comparison in the September and December quarters will normalise, and the underlying operating trajectory will become visible again. Companies that hid a soft quarter behind a favourable rate will not be able to repeat it.
China pricing reform has further to run. A 15 per cent decline at Roche and a segment guidance cut at Siemens Healthineers are not one-quarter events. Both are structural repricing, and both create openings for regional suppliers who can meet tender economics that multinational cost structures cannot.
Korea's two majors are converging on scale. Samsung Biologics and Celltrion arriving at KRW 5 trillion in the same year, through opposite business models, changes the competitive frame for contract manufacturing across the region. Watch how the PolyPeptide integration affects peptide capacity pricing in particular.
The obesity category now has one clear leader. Capacity, device and logistics commitments across Asia-Pacific were made on the assumption of two compounding customers. One of them has guided to flat or declining sales. That assumption needs revisiting before the next capital cycle, not after it.
The 29 September line is the next hard date. Every company in this cohort with meaningful Asian manufacturing exposure will have to say something about it on their October and November calls. The quarter just reported is the baseline against which that commentary will be judged.
The June 2026 quarter will be remembered, if it is remembered at all, as a good one. It was. But the version of it that appears in the aggregate headlines, in dollars, with the deal charges left in and the fiscal calendars unaligned, describes a sector that barely grew. The version assembled from the same filings in operating terms, aligned to the calendar, describes something quite different: an Asia-Pacific manufacturing base running at record output, a regional market absorbing genuine pricing pain, and a set of Western majors whose Asian exposure is now large enough that policy in Beijing and Washington moves their earnings per share by more than their pipelines do.
That is the translation problem. It is not going to get simpler.
Explore More: https://www.biospectrumasia.com/financialresults-lifescience-companies
Sources and method
All figures in this analysis are drawn from company results announcements, earnings releases and earnings call transcripts published between 21 July and 6 August 2026, covering the three months ended 30 June 2026. Where companies report on differing fiscal calendars, results have been aligned to the calendar quarter. Quoted remarks are reproduced as given in the relevant company release or call transcript. Growth rates are stated on the basis each company itself uses, and where reported and constant-currency figures differ materially, both are given. Currency conversions are those supplied by the reporting company.
BioSpectrum Asia will publish a follow-up analysis covering the remaining Asia-Pacific reporters, including Astellas, Eisai, Chugai, Otsuka, Sino Biopharm, WuXi AppTec, WuXi Biologics and CSL, together with the balance of the Indian pharmaceutical and medical technology cohort.


